Reports and the monthly report
Income from memberships and products, members joining and leaving, attendance and top products, plus a full monthly report as PDF or Excel.
Reports show how the facility is doing: all income, memberships and products together, how many members joined and left, how busy you were and what sold best. The monthly report puts one whole month on one page and exports it for your accountant.
Before you start
You need the Reports feature on your plan and the View reports permission. Owners have it. Reports cover the facility selected at the top of the dashboard.
The Reports page
Open Staff, Reports and pick This Month, Last Month or This Year.
| Section | What it shows |
|---|---|
| Total Members, New This Period | All members of the facility, and how many were added in the period. |
| Total Revenue | Membership income plus product income in the period, with the number of paid sales. |
| Total Check-ins | Check-ins in the period, with the average per day. |
| Revenue Breakdown | Membership income, Product income, Avg Order Value and Transactions, then the split By Payment Method and By Source (POS, kiosk, imported). |
| Member Activity | Joined, Churned (members set to inactive in the period) and the Net Change. |
| Attendance | Check-ins, Unique Members and the average per day. |
| Income per day | A chart of each day in the period. |
| Income per month | The last 12 months, memberships and products side by side. |
| Income per plan | Membership payments grouped by plan. |
| Members per month | New, Expired and Active at month end for the last 12 months. |
| Top Products | The five best sellers by quantity. |
Where the income comes from
- Membership income is every completed payment recorded against a member's membership: memberships assigned with a payment on the member's profile, balance payments, online payments from your website or portal, and settled partner visits.
- Product income is every paid sale under Purchases: the POS and the kiosk, including memberships sold at the till.
Earnings only shows the second part, so Reports is the page for your total income.
The monthly report
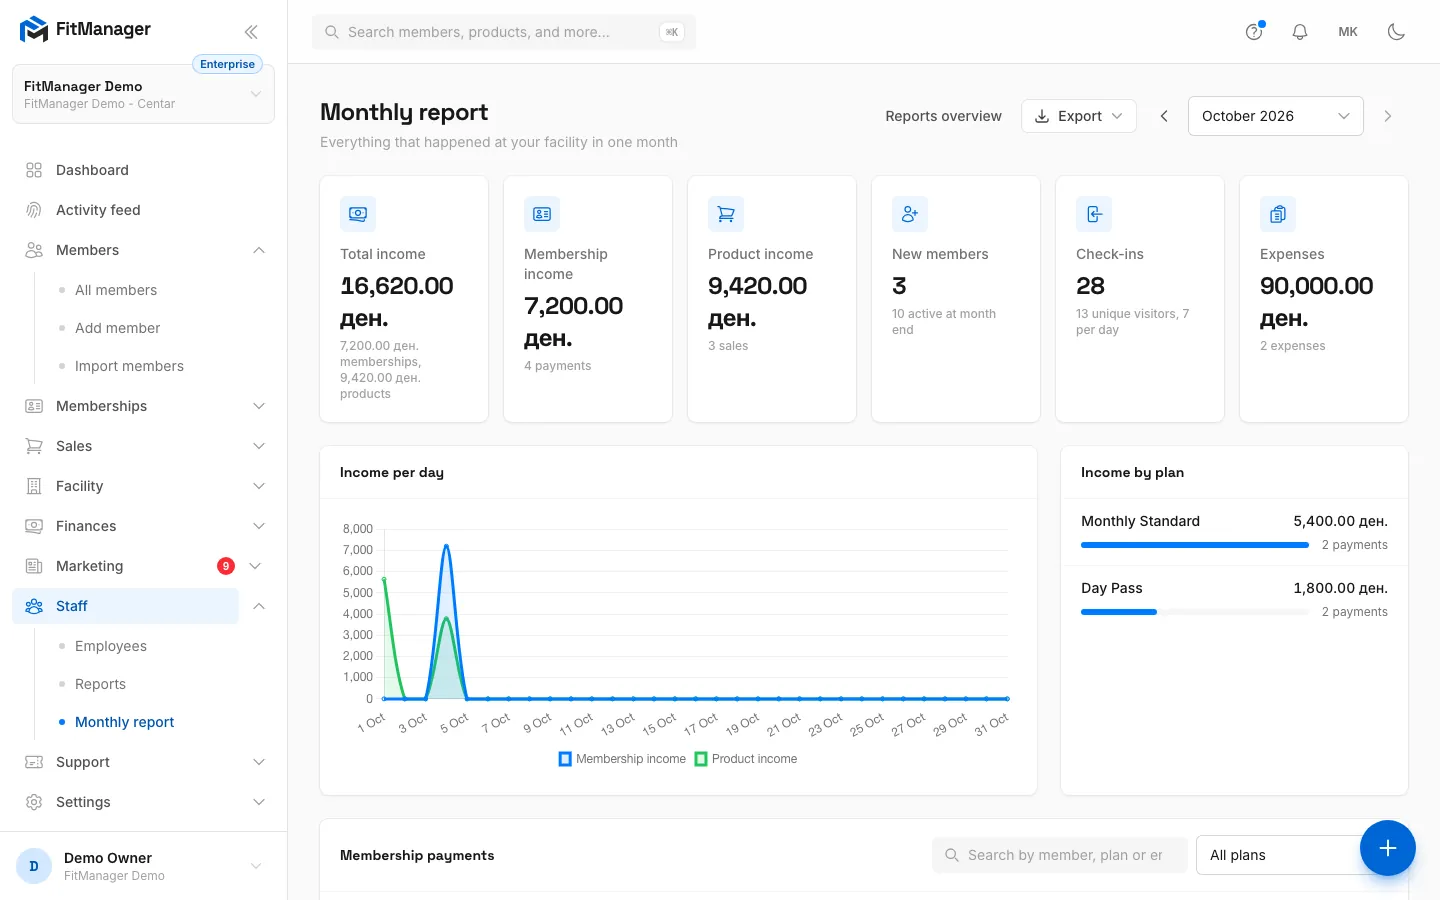
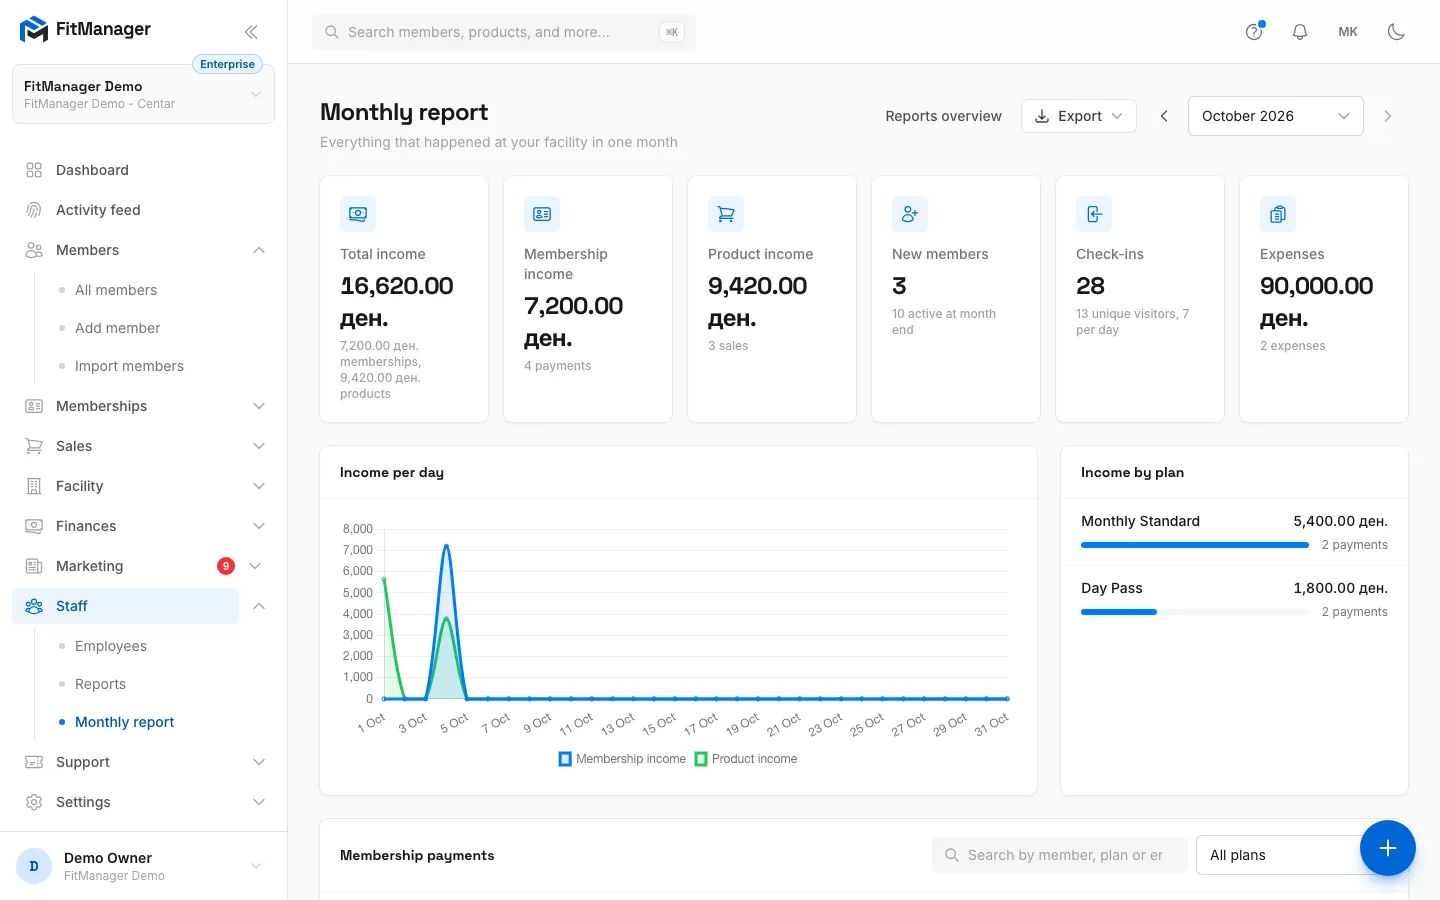
The monthly report lists everything that happened in one month.
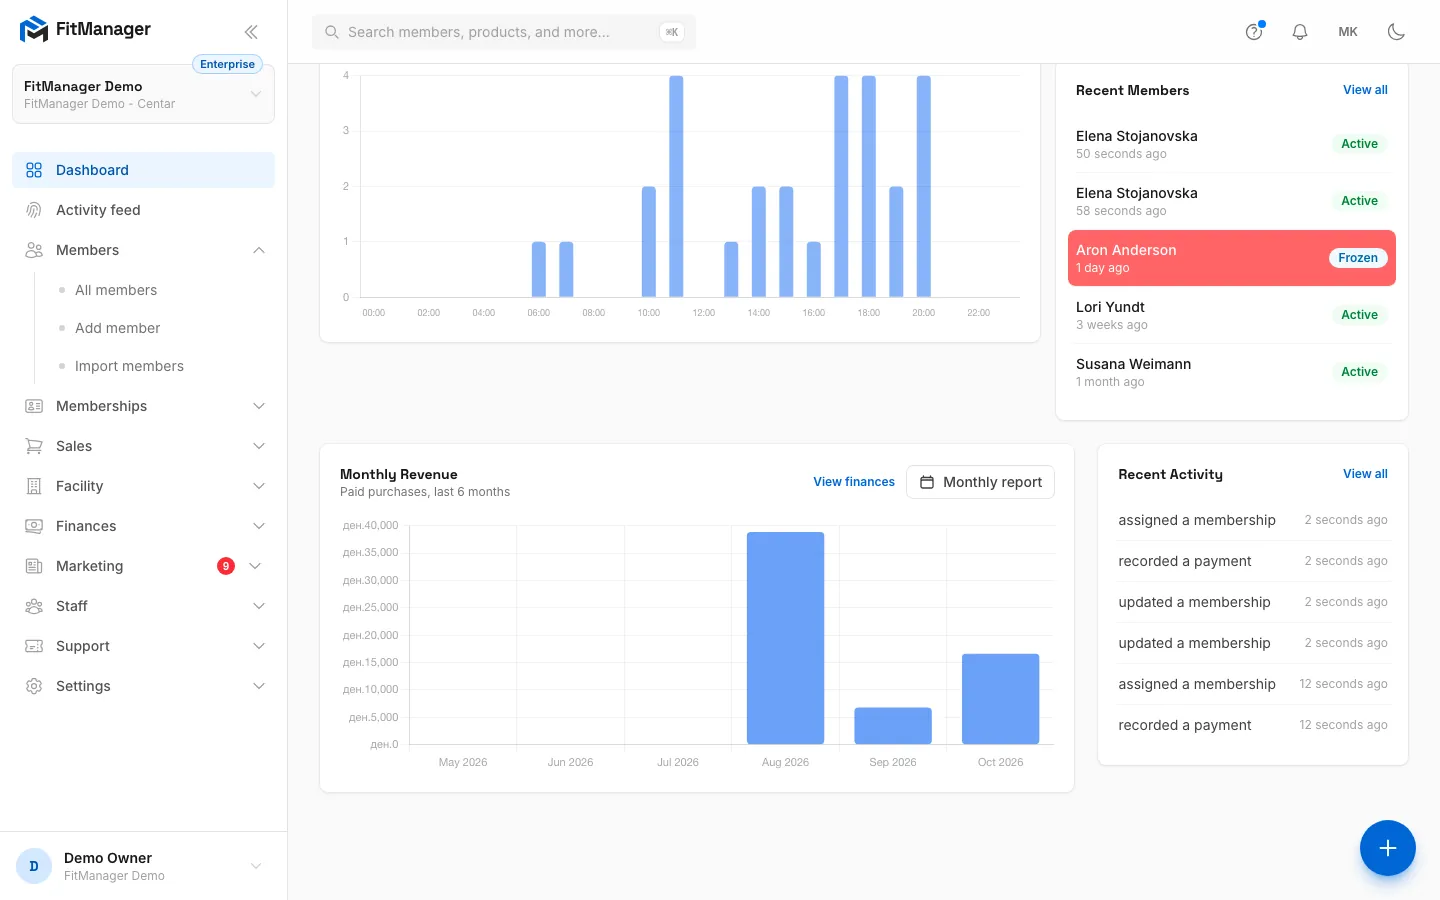
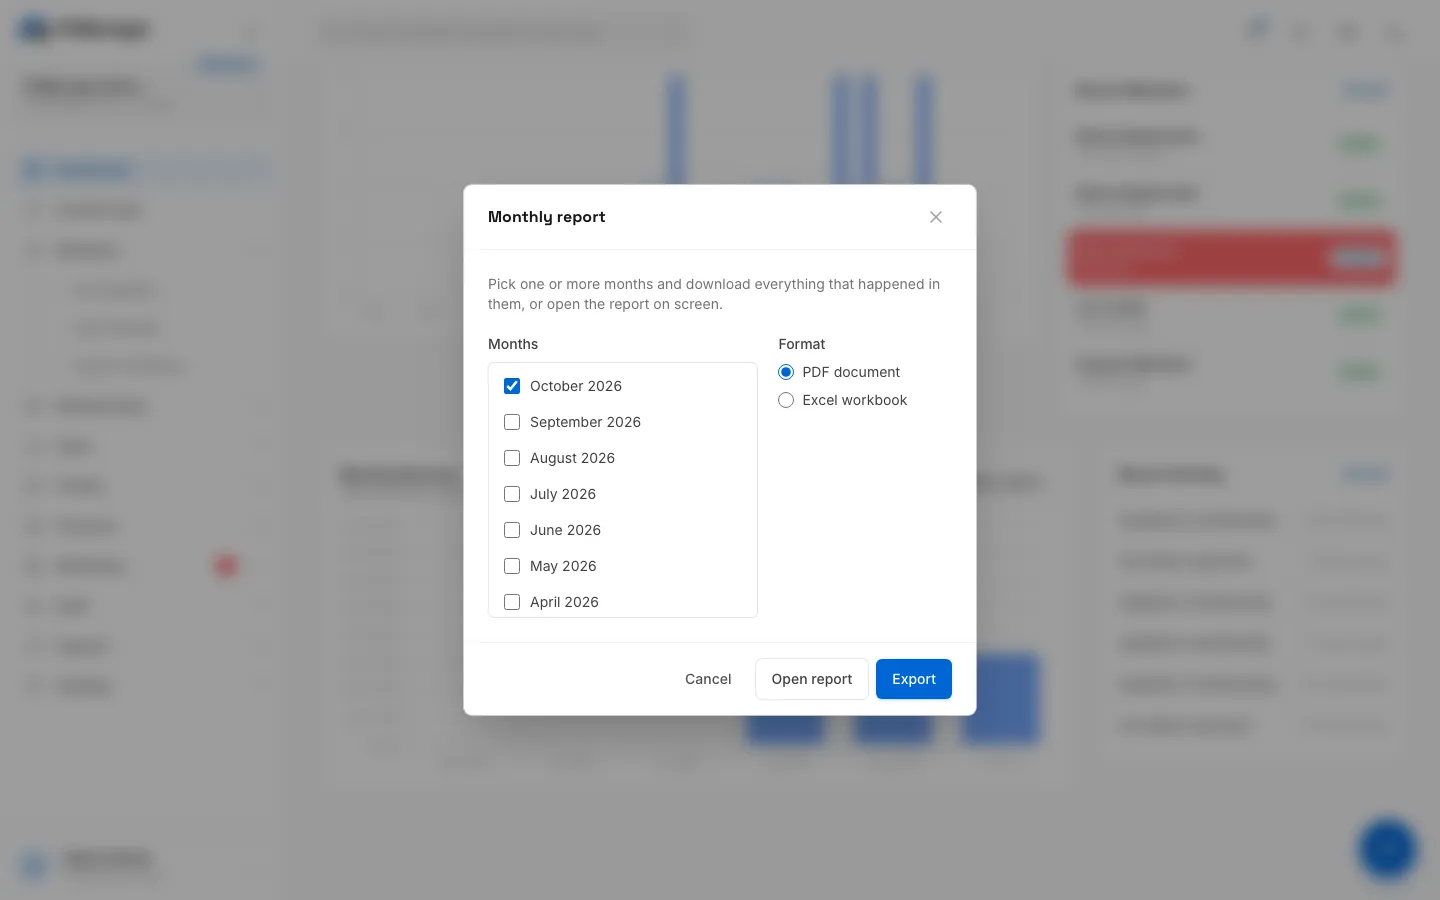
- Step 1: On the Overview, click Monthly report.
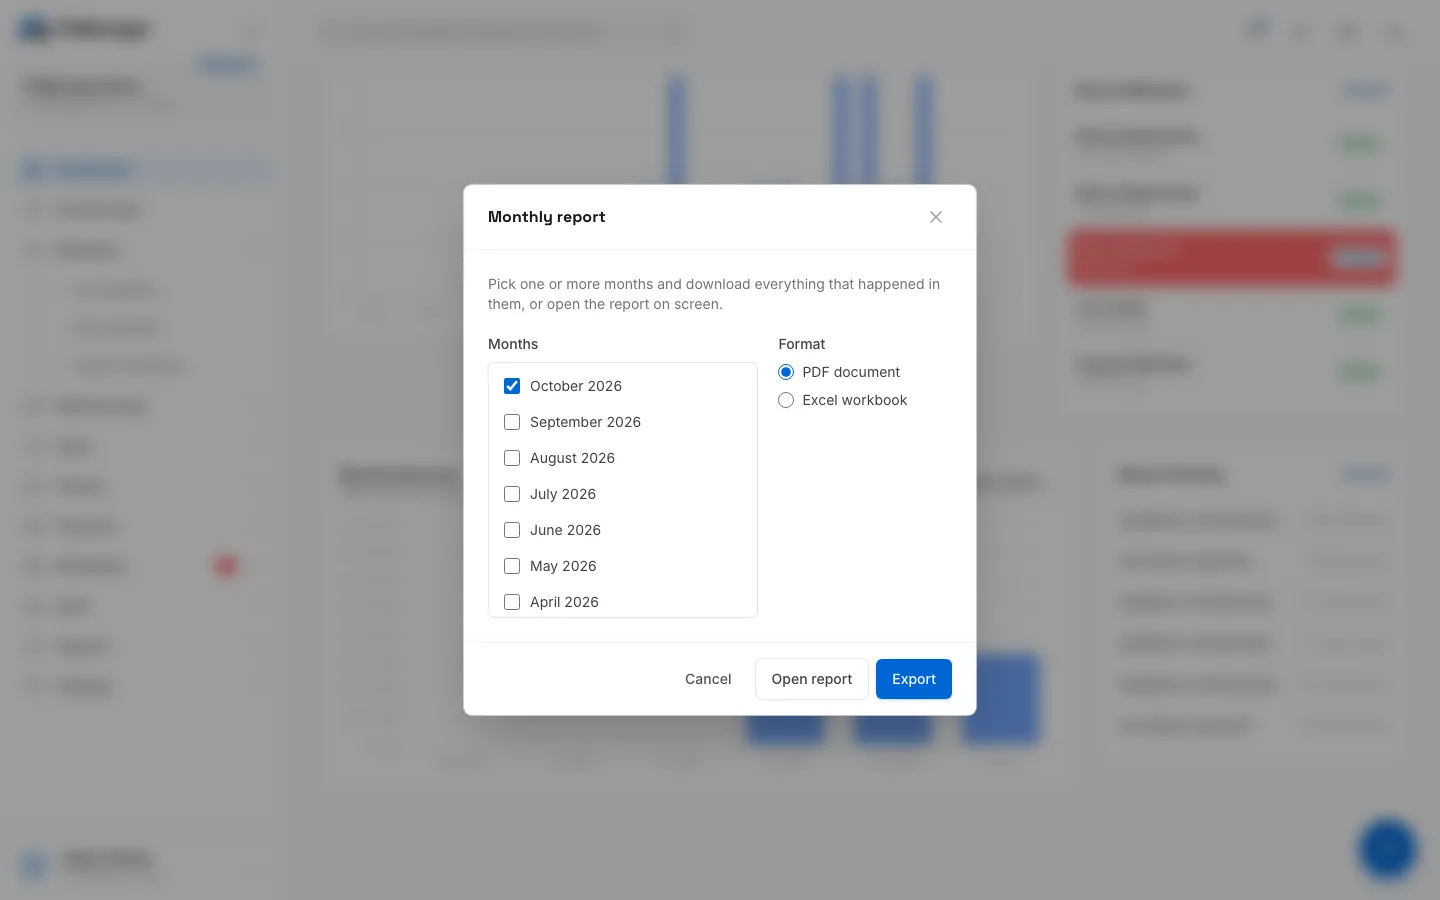
- Step 2: Tick one or more months. The current month is ticked for you.
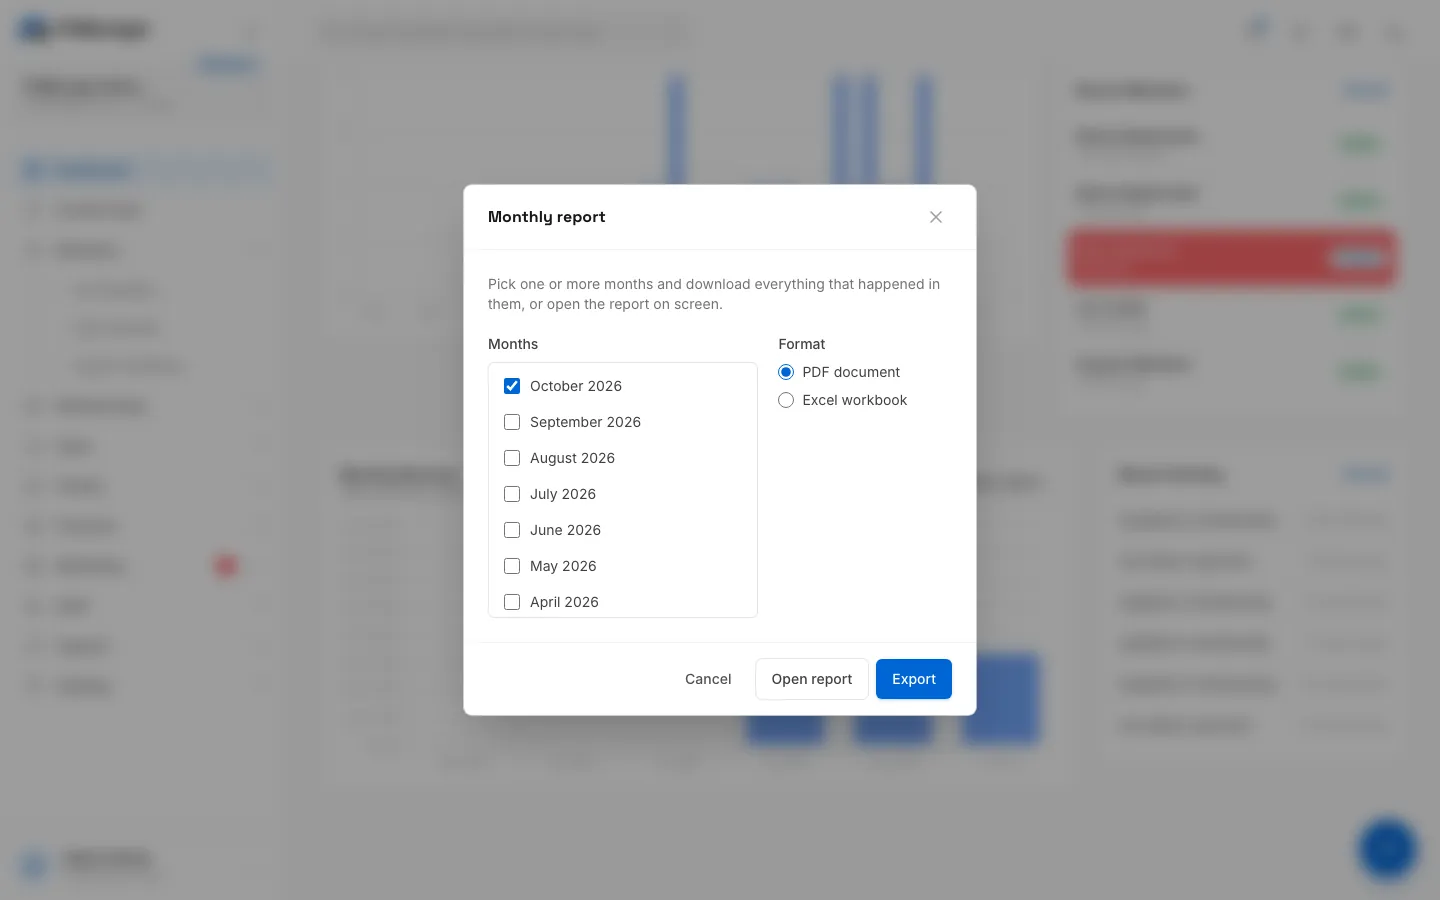
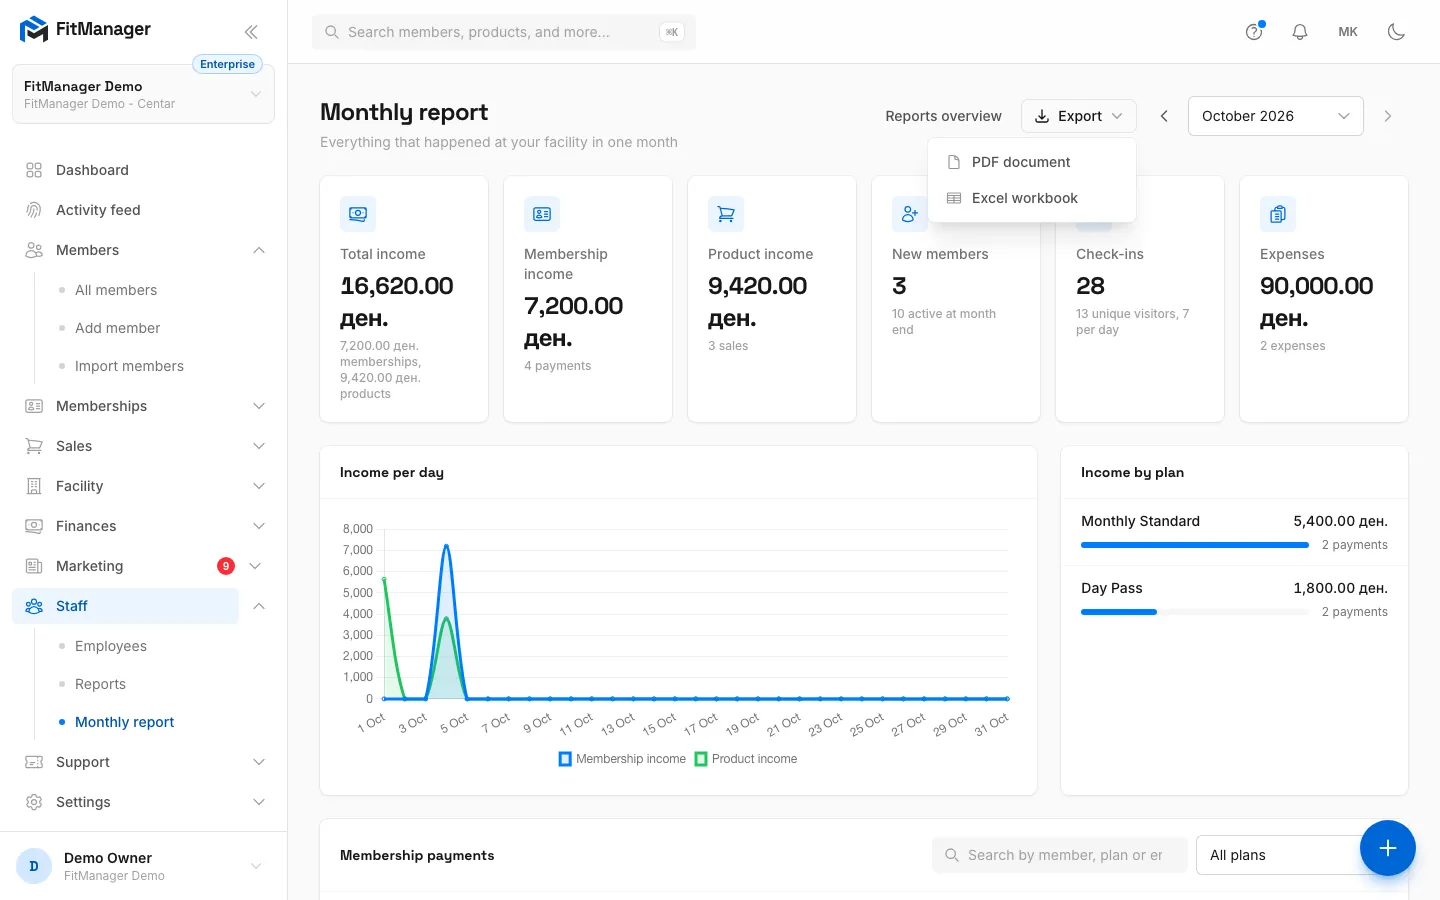
- Step 3: Choose PDF document or Excel workbook, then click Export to download.
- Step 4: Or click Open report to see the month on screen.
- Step 5: Switch months with the arrows or the month list.
- Step 6: Export downloads the month you are looking at.
- Step 7: Pick PDF for printing or Excel for your accountant.
Open it from Staff, Monthly report, from the Monthly report button on the Reports page, or from Monthly report on the dashboard Overview. Choose the month with the arrows or the month list. Future months are not available.
It contains:
- Total income split into memberships and products, New members with the number active at month end, Check-ins with unique visitors and the busiest day, and Expenses.
- Income per day and Income by plan.
- Membership payments: every payment with the member, plan, employee, date, method, source and amount. Filter by plan or search by member, plan or employee. Total of shown rows adds up what is on screen.
- Product sales: every sale with its number, member, cashier, date, method, source, status and amount, searchable.
- Members who joined with their first plan.
- Top products.
- Expenses, with category, vendor and who recorded them.
The expense figures and the expense list only appear for users who also have the View expenses permission.
Export to PDF or Excel
On the monthly report, click Export and choose PDF document or Excel workbook. The file is for the month on screen.
To export several months in one file:
- On the dashboard Overview, click Monthly report.
- Tick the Months you want. The current month is ticked already.
- Choose the Format.
- Click Export. Open report shows the earliest ticked month on screen instead.
The Excel workbook has a Summary sheet with one row per month, and sheets for Membership payments, Product sales, Members who joined and Top products, plus Expenses when you can see them. Every row carries its month, so several months sit in the same sheets.
Common questions
Why do Reports and Earnings show different totals?
Earnings counts sales only. Reports adds membership payments made on member profiles, online and through partners.
Does a refund lower the report?
Yes. A sale refunded with a storno is no longer paid, so it drops out of product income.
Can I report on all facilities at once?
Reports cover one facility at a time. Switch facility at the top and export each one.
Was this page helpful?
Related articles
Still stuck?
Write to us and we will get back to you within one working day.